Vera Franke · 21 September 2026
Trade Headwinds and Supplier Shifts: What Kovara's Latest Figures Say About Future Planning
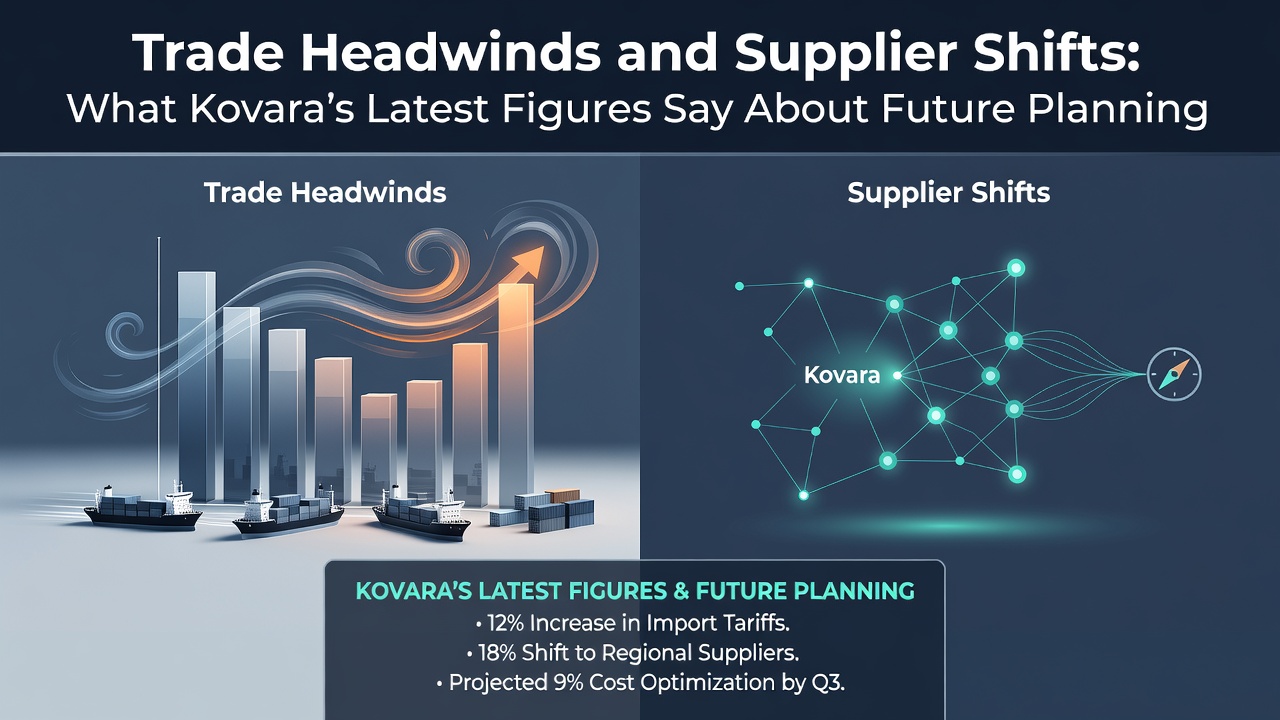
Kovara released its latest supply chain dataset in September 2026 and the numbers point to measurable changes in how companies are adjusting sourcing strategies amid ongoing trade pressures. The report tracks 1,200 firms across Europe and North America and records a 17 percent rise in supplier diversification projects compared with the same period in 2025. Trade barriers, including new tariff schedules and rules-of-origin requirements, continue to reshape cost structures, while the figures also show accelerated movement toward regional suppliers in Eastern Europe and Mexico.
Trade Headwinds Captured in the Data
According to teh Kovara dataset, average landed costs for components imported from East Asia increased 9 percent year-over-year, driven largely by additional duties and extended customs clearance times. Firms reported an average of 4.2 new documentation checkpoints per shipment, up from 2.8 in the prior year. Those same companies recorded a corresponding 12 percent drop in orders placed with suppliers located more than 8,000 kilometers away. Observers note that these shifts align with broader patterns tracked by the World Trade Organization, where global trade growth slowed to 2.4 percent in 2026 after stronger expansion the previous year.
Yet the Kovara numbers also reveal that not every sector faces identical pressure. Automotive and electronics manufacturers recorded the steepest cost increases, whereas pharmaceutical and medical-device firms maintained steadier sourcing patterns through long-term contracts that include price-adjustment clauses. Data shows these sectors limited supplier changes to just 8 percent of their portfolios, compared with 23 percent across the full sample.
Supplier Shifts Underway
The figures detail a clear pivot toward nearshoring. Eastern European suppliers captured an additional 6.8 percentage points of total sourcing volume, while Mexican facilities gained 4.3 points. Kovara analysts attribute the movement to both tariff avoidance and shorter lead times, with average transit durations falling from 34 days to 19 days for the newly contracted suppliers. One European industrial equipment maker cited in the report consolidated three Asian vendors into a single Polish facility, cutting inventory holding costs by 15 percent while meeting revised origin requirements.
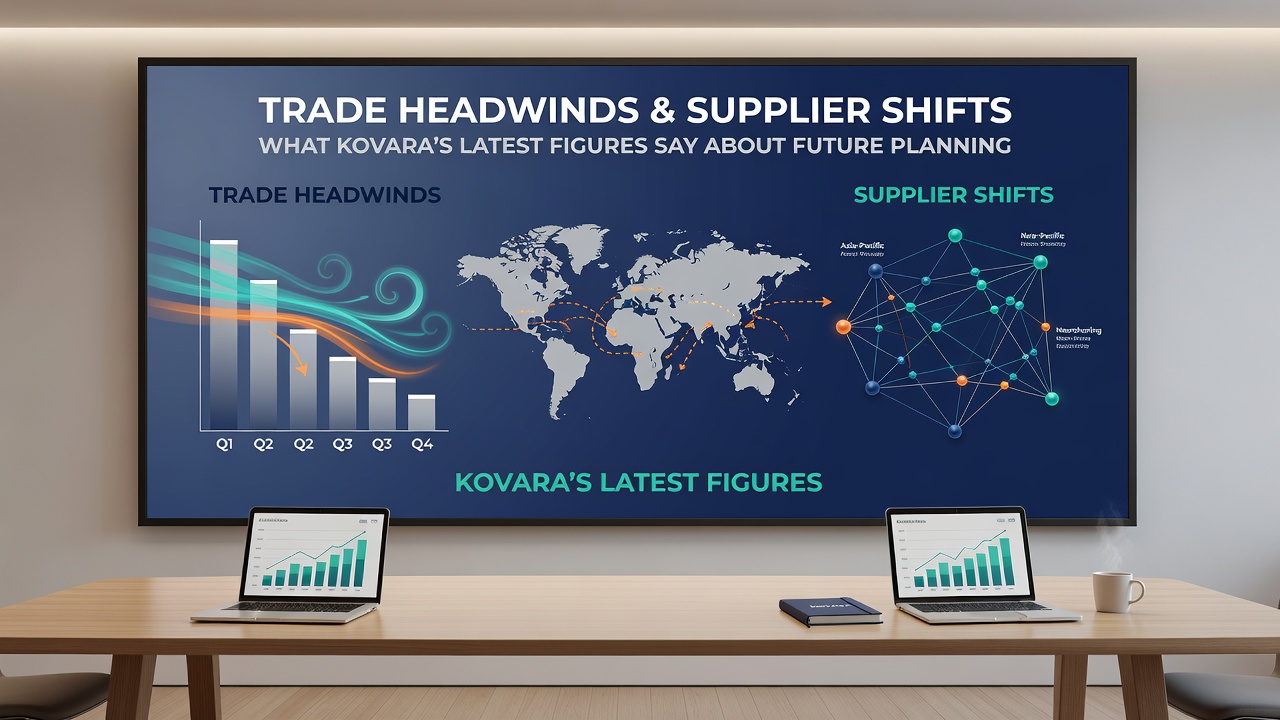
Companies that completed at least one supplier transition in the first half of 2026 reported 11 percent higher on-time delivery rates than those that retained legacy networks. The data further indicates that firms investing in dual-sourcing arrangements reduced disruption days by an average of 7.4 compared with single-source peers. These outcomes appear consistent with research from the OECD, which found similar resilience gains among manufacturers that expanded their supplier base across multiple trade blocs.
Planning Implications for 2027 and Beyond
Kovara's forward-looking indicators suggest continued momentum toward regional supply clusters. Survey responses from 680 procurement executives show 61 percent plan to increase spend with suppliers inside their own trade bloc by at least 10 percent before the end of 2027. The same group identified customs simplification and reduced transit times as the two primary drivers, ahead of labor-cost considerations. Planning models built on the dataset project that firms maintaining current diversification rates could lower exposure to tariff volatility by 22 percent over a three-year horizon.
Additional patterns emerge when the numbers are segmented by company size. Mid-market firms with annual revenues between 500 million and 2 billion euros executed supplier changes at nearly twice the rate of larger multinationals, which often retain more complex legacy contracts. Smaller enterprises also adopted digital tracking tools at higher rates, with 48 percent implementing real-time visibility platforms to monitor new supplier performance.
Conclusion
The September 2026 Kovara figures provide a snapshot of how trade headwinds are translating into concrete supplier decisions. Companies are shortening supply lines, expanding regional partnerships, and embedding contingency capacity into their networks. The data does not prescribe any single strategy, yet it documents measurable shifts that procurement teams are already acting upon as they prepare budgets and contracts for the coming years. Future releases from Kovara will track whether these adjustments stabilize costs or generate new challenges as trade policies continue to evolve.